

Watershed Delineation in Surat (Gujarat) Using QGIS
Why Watershed Delineation of a region is important?
The management of a watershed depends on having an accurate delineation of the watershed’s boundaries. This is an extremely vital responsibility. The borders that have been set serve as the nucleus around which various aspects of management, such as land use, land change, soil types, geology, and river flows, are analysed and appropriate conclusions are reached.
How to do Watershed Delineation in Gujarat?
QGIS water demarcation maps for Gujarat require these steps:
1. Get water demarcation data from satellite photos or government data. QGIS can import data.
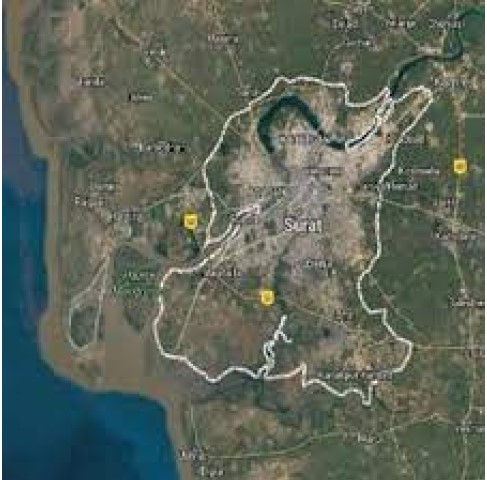
2. Get a Surat shapefile: A shapefile contains the shape of the region you want to map. Surat shapefiles are available from Natural Earth and the Gujarat state government website. https://dataspace.mobi/dataset/surat-zone-boundary/resource/34d16cf2-9671-4bd1-82
c2-9d38ad3a4612
3. Both datasets: Add water delineation and shapefile layers to QGIS. https://dataspace.mobi/dataset/waste-water-drainage.
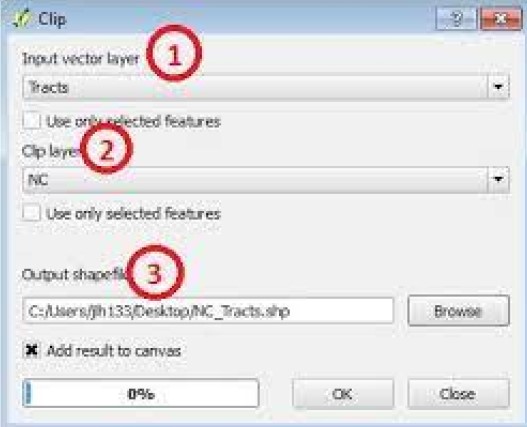
4. Surat’s water boundary: The “Clip” tool cuts the water demarcation layer to the Surat shapefile.
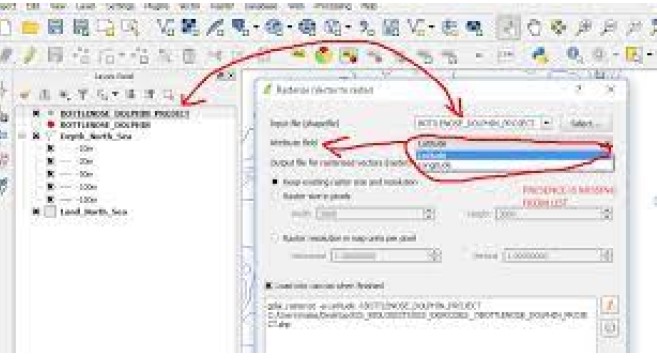
5. Water demarcation layer raster: QGIS’ “Rasterize” tool can rasterize the clipped water demarcation layer. This creates a raster layer containing water body cells.
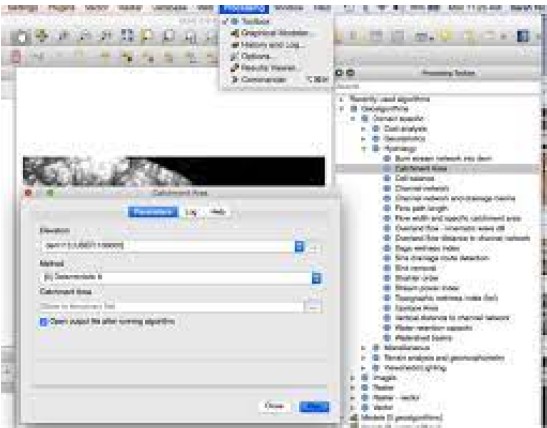
6. Use the QGIS Hydrology toolbox to evaluate water flow, drainage basins, and other characteristics. Use tools to extract streams, rivers, and lakes from the raster layer.
7. Customise water bodies: After extracting the required characteristics, style them differently from the other layers in your map. Map water bodies with colours, patterns, or symbols.
8. Customise the map: You can change the map projection, colour scheme, and labels after creating it.
9. Map export: Finally, export the map as an image or PDF for usage.
Why to use QGIS software for mapping watershed delineation of a region:
Geotechnical engineers use QGIS software for mapping watershed delineation because QGIS is a powerful open-source Geographic Information System (GIS) software that can help in analysing and visualising spatial data, including hydrological data like river networks and watersheds, geotechnical engineers may use the QGIS tool for watershed delineation for a specific region. This is due to the fact that QGIS is able to assist in the delineation of watersheds.
The act of determining and mapping the borders of a watershed, which can be thought of as a region of land that is drained by a certain stream or river, is referred to as watershed delineation. The geotechnical engineers who use QGIS have access to a number of tools and plugins that can assist them in analysing and modelling the hydrological features of a particular location. These characteristics include elevation, slope, aspect, and precipitation data.
Digital Elevation Models (DEMs) can be generated from satellite or LiDAR data by geotechnical engineers using QGIS. These DEMs are then used to determine drainage patterns and to split the area into watersheds. The software is also able to calculate hydrological characteristics, which are extremely important for the management and planning of watersheds and include flow direction, flow accumulation, and stream network topology.
In general, QGIS is a useful tool for geotechnical engineers who are involved in watershed delineation and other types of hydrological studies because it provides a wide range of tools for data analysis, visualisation, and modelling. These tools can assist geotechnical engineers in making informed decisions and recommendations that are founded on reliable scientific data.
Motivation for the Project
Management of Water Resources: Watershed maps give useful information on the water resources that are accessible in a specific area. This information includes the location and extent of water bodies such as rivers, lakes, and reservoirs. Watershed maps can also be used to regulate water quality. This information is absolutely necessary for the efficient administration and planning of water resources.
Management of Floods: Accurate watershed maps can be helpful in identifying regions that are at risk of flooding during significant rainfall events. This enables authorities to take preventative actions such as erecting flood protection structures and developing early warning systems.
Agricultural Planning: Agriculture is a big economic activity in the Surat district, and precise watershed maps can assist farmers in more successfully planning their crops and irrigation systems, based on the availability of water resources in their region. Agriculture is a major economic activity in the Surat district.
Conservation of the Environment: Watershed maps can also help identify areas of ecological significance, such as wetlands, forests, and wildlife habitats. This enables authorities to take efforts to protect these areas from human invasion and development. Watershed maps can also help identify regions of ecological significance.
In general, mapping the watershed delineation of the Surat district in Gujarat is essential for a variety of reasons, including but not limited to effective water resource management, flood management, agricultural planning, and environmental conservation.
References
1. https://www.isprs.org/proceedings/xxxiv/part1/paper/00080.pdf
2. https://www.google.com/url?sa=i&url=https%3A%2F%2Flink.springer.com%2Fchapter%2F10.1007%2F978-3-030-932473_75&psig=AOvVaw3IlLyEw4Ez8ZyB0VMgY4bU&ust=1682781602871000&source=images&cd=vfe&ved=0CBMQjhxqFwoTCPiJ553wzP4CFQAAAAAdAAAAABAQ
3. https://www.google.com/imgres?imgurl=https%3A%2F%2Fwww.researchgate.net%2Fprofile%2FDhaval-M-Patel%2Fpublication%2F321421987%2Ffigure%2Ffig1%2FAS%3A566714580598784%401512126693131%2FSatellite-image-of-Surat-Source-https-wwwgooglecoin-maps-place-Surat_Q320.jpg&tbnid=8RPrHv7I1icz4M&vet=12ahUKEwjk6au49sz-AhVd_3MBHUyxBvUQMygAegUIARC2AQ..i&imgrefurl=https%3A%2F%2Fwww.researchgate.net%2Ffigure%2FSatellite-image-of-Surat-Source-https-wwwgooglecoin-mapsplace-Surat_fig1_321421987&docid=tmjRbDsydcQo8M&w=320&h=320&q=Satellite%2
0photos%20of%20Surat&ved=2ahUKEwjk6au49sz-AhVd_3MBHUyxBvUQMygAegUIARC2AQ
4. https://dataspace.mobi/dataset/surat-zone-boundary
5. https://dataspace.mobi/dataset?license_id=notspecified&tags=UDS2022
6. https://www.google.com/imgres?imgurl=https%3A%2F%2Fdges.carleton.ca%2FCUOSGwiki%2Fimages%2Fthumb%2Ff%2Ff6%2FCatch1.png%2F700px-Catch1.png&tbnid=aSsJ8moBvGy3tM&vet=12ahUKEwjqrffV98z-AhV623MBHUt4CZcQMygBegUIARDDAQ..i&imgrefurl=https%3A%2F%2Fdges.carleton.ca%2FCUOSGwiki%2Findex.php%2FExpl
oring_the_Hydrological_Tools_in_QGIS&docid=KD8OyAwcbbRGXM&w=700&h=541&q=qgis%20hydrology%20toolbox%20on%20qgis&ved=2ahUKEwjqrffV98z-AhV623MBHUt4CZcQMygBegUIARDDAQ
7. https://www.google.com/url?sa=i&url=https%3A%2F%2Fgis.stackexchange.com%2Fquestions%2F226447%2Fusing-rasterize-tool-in-qgis&psig=AOvVaw1-Y_63a7tN0yjVBF3Bs-QA&ust=1682783599104000&source=images&cd=vfe&ved=0CBEQjRxqFwoTCJCE5Of4zP4CFQAAAAAdAAAAABAE
Recent Comments